
How to Read an Earnings Report: A Beginner’s Guide
When you start investing, earnings reports can feel like they were written for accountants.
Revenue, earnings, margins, cash flow, guidance—it can quickly become overwhelming.
But you don’t need to understand every number.
An earnings report is simply a company’s way of telling investors how the business performed and what it expects to happen next.
Think of it as a report card for a business.
What Is an Earnings Report and Why Does It Matter?
An earnings report is a financial update that companies usually release every three months.
It tells investors things like:
- How much the company sold
- How much it spent
- How much profit it made
- How much cash it generated
- What it expects in the future
The goal isn’t to understand every detail.
Instead, ask:
Is the business growing, becoming more profitable, and staying financially healthy?

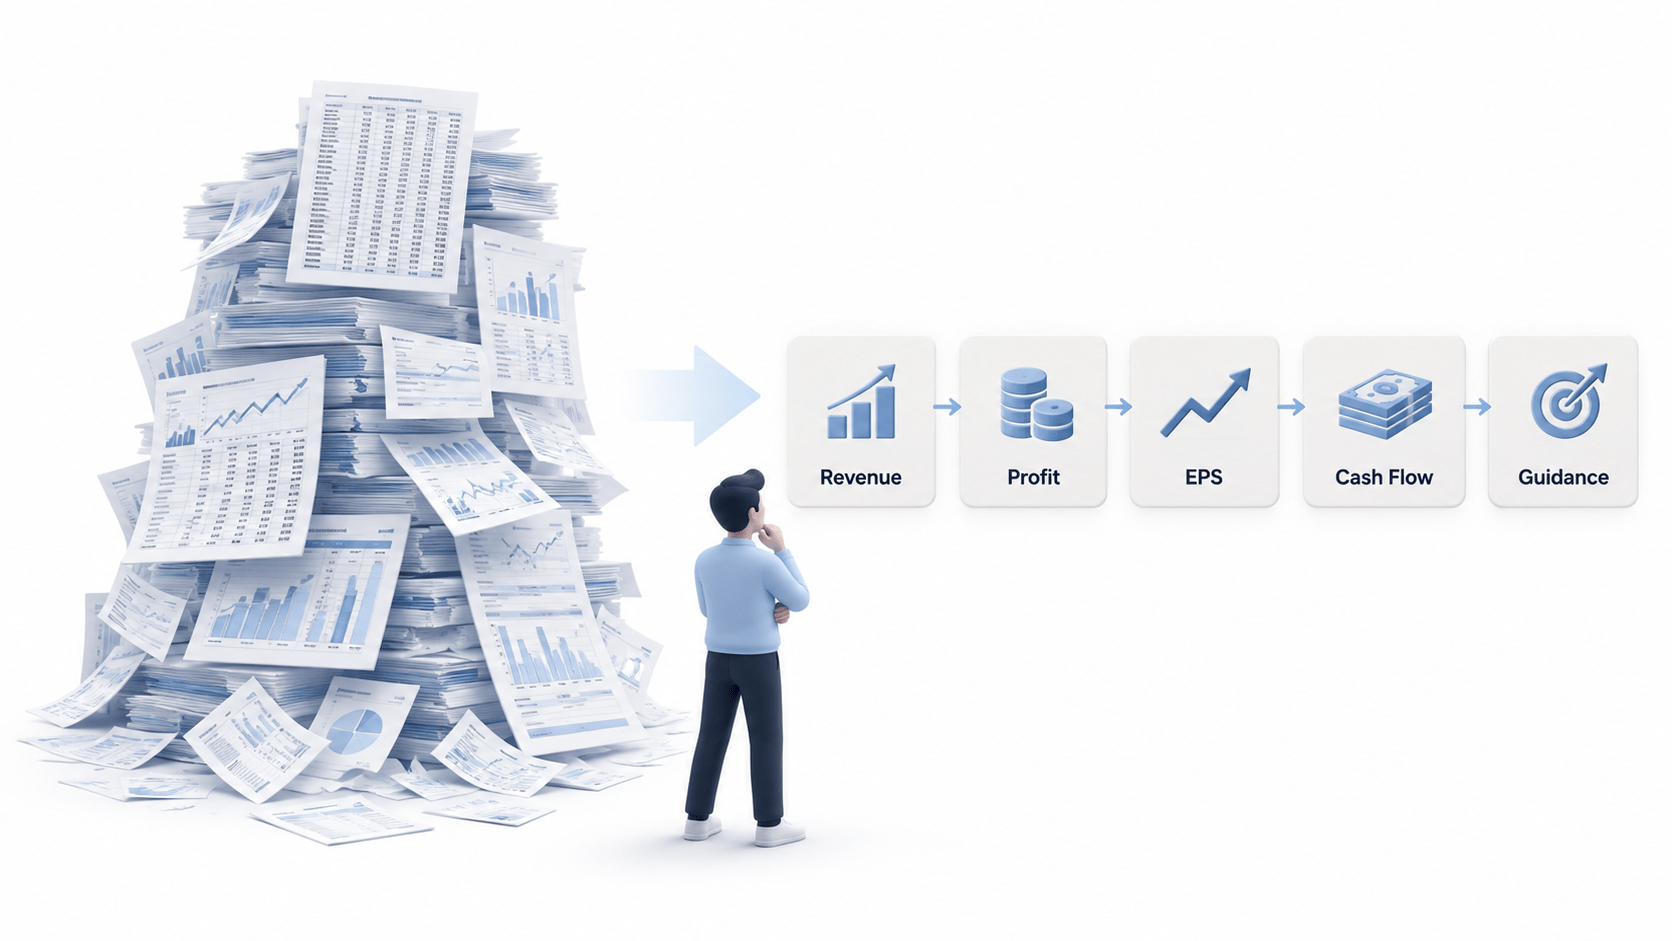
The 5 Numbers Beginners Should Look At First
You can ignore much of the complexity when you’re starting out.
Focus on these five areas.
1. Revenue: How Much Did the Company Sell?
Revenue is the money a company receives from selling its products or services.
The first question is simple:
Is revenue growing?
If revenue was $100 million last year and $120 million this year, the company is generating more sales.
That is generally a good sign, although you still need to understand why sales are growing.
2. Profit: How Much Did It Keep?
Revenue isn’t the same as profit.
A company might generate $100 million in sales but spend $80 million running the business.
That leaves $20 million in profit.
Look at whether profit is growing alongside revenue.
If sales are rising but profit isn’t, the company may be struggling with increasing costs.
3. Earnings Per Share: How Much Profit Per Share?
EPS (earnings per share) tells you how much of a company’s profit is attributed to each share.
You’ll often see investors compare actual EPS with expectations.
For example:
Expected EPS: $1.20
Actual EPS: $1.40
That’s an earnings beat, meaning the company performed better than expected.
But remember: even a strong earnings report can cause a stock to fall if investors expected even better results.
4. Cash Flow: Is Real Money Coming In?
Profit and cash aren’t exactly the same thing.
Cash flow tracks money moving into and out of the business.
One useful measure is free cash flow—the cash left after the company pays for the investments needed to operate and grow.
Strong, consistent cash flow gives a company more flexibility to invest, repay debt, or return money to shareholders.
The basic question is:
Is the business actually generating cash?
5. Guidance: What Happens Next?
Guidance is management’s outlook for the future.
Companies may give investors expectations for future sales, profits, costs, or growth.
This matters because investors care about the future—not just what happened last quarter.
A company can report excellent results but give weak guidance, causing its stock to fall.
So always ask:
“What does the company expect to happen next?”
Don’t Forget Expectations
One of the biggest beginner mistakes is looking at a number and deciding whether it’s good or bad.
Imagine a company earns $5 billion.
Sounds great.
But what if investors expected $6 billion?
The important lesson is:
Stocks react to what happened compared with what investors expected.
That’s why a company can report record profits and still see its stock fall.
The company may have done well—it just didn’t do well enough to meet expectations.
A Simple Way to Read Any Earnings Report
Instead of reading everything, start with five questions:
1. Is revenue growing?
Are sales increasing compared with last year?
2. Is profit growing?
Is the company keeping more money after expenses?
3. Did earnings beat expectations?
How did actual EPS compare with forecasts?
4. Is the company generating cash?
Is cash flow healthy?
5. What happens next?
What does management expect?
If you can answer these five questions, you’ll understand much of what matters.
What About All Those Other Numbers?
Eventually, you can learn about things like profit margins, debt, inventory, and return on equity.
But don’t try to learn everything at once.
For example, profit margin simply tells you how much of a company’s revenue becomes profit.
If a company makes $100 and keeps $20 as profit, its profit margin is 20%.
Start with the basics and add more knowledge over time.
You don’t need to memorize financial terminology.
You need to understand what the numbers are telling you about the business.
The Psychology of Earnings Reports
Earnings reports can also trigger emotional reactions.
A company beats expectations and the stock jumps 10%.
You feel like you’re missing out.
A company misses expectations and falls 15%.
Suddenly, you feel like something is terribly wrong.
This is where recency bias can appear—the tendency to give too much weight to recent events.
One bad quarter doesn’t necessarily mean a great company has become a bad investment.
One great quarter doesn’t mean a company can do no wrong.
Instead, ask:
“Has the long-term story of this business actually changed?”
One earnings report is only one piece of the puzzle.
Don’t Turn Earnings Into a Guessing Game
It’s tempting to focus on predicting what will happen after an earnings announcement.
Will the stock rise?
Will earnings beat expectations?
Will guidance increase?
But long-term investors don’t necessarily need to predict tomorrow’s stock price.
A better question is:
“Is this business becoming stronger, weaker, or staying roughly the same?”
That question is much more useful.
Final Thought
Earnings reports look complicated because they contain a lot of information.
But you don’t need to understand everything.
Start with:
Revenue. Profit. EPS. Cash flow. Guidance.
Then ask:
“What does this report tell me about the health and future of the business?”
You don’t need to become an accountant to understand a company.
You just need to learn how to separate the important information from the noise.
Want to Practice?
The best way to learn is to look at a real earnings report. Pick a company you know and search:
[Company name] investor relations earnings
For example:
- Apple investor relations earnings
- Microsoft investor relations earnings
- NVIDIA investor relations earnings
- Samsung investor relations earnings
Then use the five questions from this article to see if you can understand the company’s latest results. Most companies publish their quarterly earnings releases and supporting financial information on their Investor Relations pages.
Recommended Reading
The Little Book of Valuation— Aswath Damodaran
Once you understand earnings reports, the next question is:
“What do these numbers tell me about what the company is actually worth?”
The Little Book of Valuation helps connect financial information like revenue, profit, and cash flow to company valuation.
It’s a great next step from understanding financial statements to actually using them as an investor.
Disclosure: Some links in this article may be affiliate links, meaning Pathidon may earn a small commission at no extra cost to you.

Stefan Theron
Founder of Pathidon
Stefan holds a degree in Psychology and an MBA, and has spent years studying behavioral finance, market psychology, and the decision-making patterns that shape how people invest — bridging the gap between financial knowledge and human behavior.